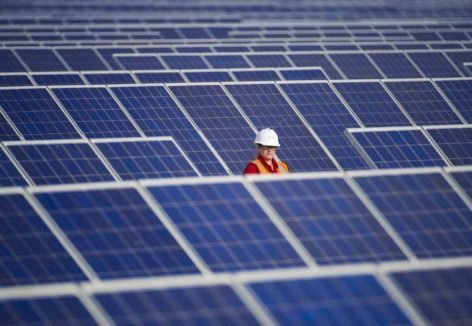
The U.S. installed 1,393 megawatts (MW) of solar photovoltaics (PV) in the second quarter of 2015 to reach 22.7 gigawatts (GW) of total installed capacity, enough to power 4.6 million American homes. The residential market had another record quarter, with 70 percent growth year-over-year, while the utility-scale segment dominated again with 729 megawatts (MW) of installed capacity.
The quarterly SEIA/GTM Research U.S. Solar Market Insight™ report shows the major trends in the U.S. solar industry. Learn more about the U.S. Solar Market Insight Report.
Key Figures
- The U.S. installed 1,393 MWdc of solar PV in Q2 2015, marking the seventh consecutive quarter in which the U.S. added more than 1 GWdc of PV installations.
- Q2 2015 was a milestone quarter for the U.S. solar PV market, with cumulative installations eclipsing the 20 GWdc mark.
- Throughout the first half of 2015, 40% of all new electric generating capacity brought on-line in the U.S. came from solar.
- 21 states have now added more than 100 MWdc of solar PV, but the top five states still account for nearly three-fourths of cumulative U.S. PV installations.
- 40% of the 16.6 GWdc utility PV pipeline in development has been procured primarily due to solar’s economic competitiveness with fossil-fuel alternatives.
- We forecast that PV installations will reach 7.7 GWdc in 2015, up 24% over 2014. Growth will occur in all segments, but will be most rapid in the residential market.
- 2014 was the largest year ever for concentrating solar power, with 767 MWac brought on-line. The next notable CSP project slated for completion is SolarReserve’s 110 MWac Crescent Dunes, which entered the commissioning phase in 2014 and is expected to become fully operational before the end of 2015.
1. Introduction
The U.S. solar market continues on its pace for a record-breaking year, with 1,393 MWdc in the second quarter of the year, bringing the market up to 2,722 MWdc in the first half. The second half of the year should be significantly larger than the first in terms of new deployments. We anticipate a bevy of utility-scale project completions, combined with a continued ramp in the residential market and a commercial solar resurgence in select states to bolster installations through the rest of the year.
We believe the following three stages will define the next decade for the U.S. solar market:
- Stage 1 (Today-2016): The first stage, which extends through the end of 2016, will bring an unprecedented boom in solar installations. Across all segments and most state markets, improved project economics, low interest rates, insulation from incentive reduction and the rush to complete projects ahead of the ITC step-down will accelerate an already-growing market to new heights. Between July 2015 and December 2016, the U.S. solar PV market is expected to add 18 GWdc, which would exceed cumulative installations through the first half of 2014.
- Stage 2 (2017-2019): Assuming no ITC extension, the second stage contains the most uncertainty in our forecast period. Five macro factors will be at play, pushing the market in different directions.
- First, the ITC rush of 2016 will be over, and project pipelines for commercial and utility-scale developers will be lighter. Some projects that were intended for 2016 may spill over into 2017, but we anticipate a dearth of new larger-scale projects at the beginning of stage 2
- Second, project economics will be significantly tighter as a result of ITC reduction (to 10% for commercial, utility and third-party owned residential, and to zero for host-owned residential).
- Third, interest rates could conceivably rise during this period, putting upward pressure on the cost of capital for solar projects.
- Fourth, the Clean Power Plan will not yet have taken full effect. The first compliance date for the CPP is 2022, but the rule issued by the EPA includes a Clean Energy Incentive Program intended to support renewable energy installations in 2020 and 2021. One unintended consequence of this program, if it is left unchanged, is that states may design their policies to support solar/wind installations in those years, even at the expense of earlier years (2017-2019), since those earlier installations won’t receive the same credit.
- Finally, despite these headwinds, solar project costs will continue to fall and increasingly large pockets of demand will remain open. The overall market may decline substantially year-over-year in 2017, but growth from the new, smaller smaller base will resume thereafter.
- Stage 3 (2020-2025): The third stage will usher in a new era of growth for solar in the U.S. The beginning of the Clean Power Plan (CPP) compliance era will incentivize states to support (directly or indirectly) the solar market. Meanwhile, project costs will be significantly below today’s levels, placing solar on a strong competitive playing field with both retail electricity and alternative sources of wholesale generation. Much of the uncertainty from stage 2 will have been settled, and market participants will experience a more extended period of consistent expansion. Most notably, this period will also likely be the time during which solar in the U.S. truly becomes a 50-state market, as the combination of CPP compliance and improving project economics will open up state markets that historically have seen very limited solar development.
These stages will also be marked by a growing number of states redesigning their electricity markets to accommodate the growth of distributed energy resources. While today’s focus is on states such as New York (through the REV initiative) and California (through AB 327 and its offshoots), other states will undoubtedly follow. And our expectation is that many states will be engaged in, if not already implementing, similarly transformational processes over the next decade. For this reason alone, it will be an exciting time to monitor the solar market.
